What the optimizer can be asked to do
The recommendation is a subset of the stocks you selected. The methodology is based on modern portfolio theory, and you choose the objective, the risk estimator and the constraints. This page collects every method and model the product implements.

RSJ Portfolio — Recommendation
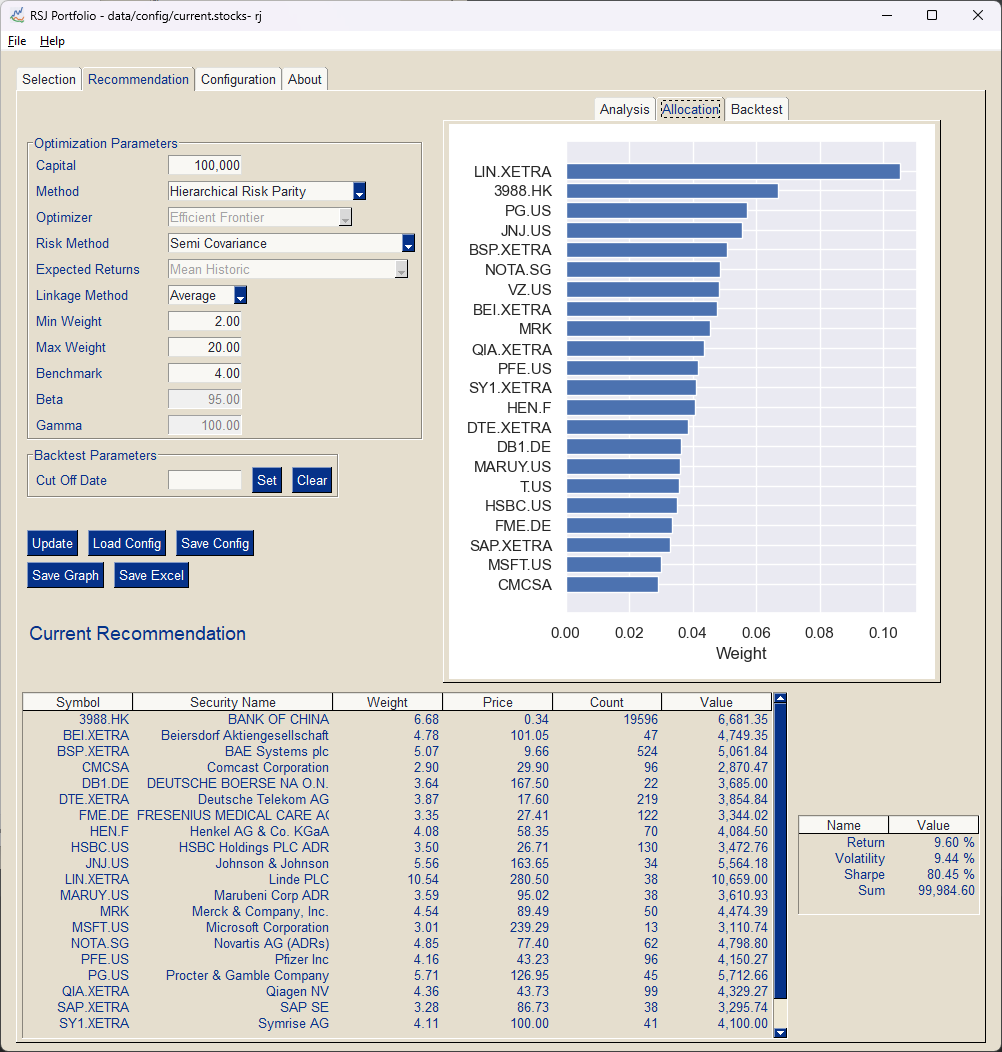
Five ways to allocate capital
The recommendation is a subset of the stocks selected in the previous tab. The methodology is based on modern portfolio theory, and you choose which objective the optimizer should pursue.
•
Minimum Volatility
•
Maximum Sharpe Ratio — optimizes the ratio between volatility and return
•
Minimum Semi Variance — minimizes downside volatility
•
Hierarchical Risk Parity — minimizes cluster portfolio based on correlation and optimizes volatility between outliers and cluster
•
Conditional Value at Risk — minimizes risk of the portfolio at a given confidence level
Hierarchical Risk Parity clusters the selected stocks and equalizes risk between the sub-trees — similar stocks are grouped by industry or region even though only prices are used. In the first steps walkthrough this is the recommended starting point, combined with Ledoit Wolf as the risk method and Ward as the linkage method.
Eight ways to determine risk
The risk of the portfolio is derived from the covariance of the selected price series. You can pick the estimator that fits the data set you are working with.
•
Covariance
•
Semi Covariance (down side only)
•
Exponential covariance
•
Ledoit Wolf
•
Ledoit Wolf Exponential
•
Ledoit Wolf Exponential single factor
•
Ledoit Wolf Constant Correlation
•
Oracle Approximation
Three ways to expect returns
Expected returns feed the Sharpe ratio and the Capital Asset Pricing Model. Choose between a plain historic mean, an exponentially weighted mean, or a market based estimate.
•
Mean Historic
•
EMA Historic — uses an exponentially weighted moving average
•
Capital Asset Pricing Model
From price data to a document
Historic prices come from a data provider of your choice, are cleaned and converted, and the resulting portfolio leaves the application in a format you can file or forward.
•
Load historic price data from a data provider
•
Yahoo Finance — free, only available for personal use
•
End of Day Historical Data — paid offering requiring a subscription that provides you with an API key
•
Export graphics as PDF files
•
Export portfolio as Excel file
•
Cache file to speed up the loading process
•
Multi currency support with linear interpolation of missing exchange rates
•
Capital Asset Pricing Model and backtest
Full parameter reference in the recommendation chapter of the user guide. The parameter table is on the getting started page.
Where to go deeper
Data & currencies
Data providers, price cleaning, caching and the USD conversion path.
Data and currencies →Getting started
Requirements, configuration, a step by step walkthrough and the results you get.
Getting started →Blog
Background articles on the optimizer, the data and the methods, from the team building it.
Product blog →